Census 2021: Ethnicity
Below you will find ethnicity statistics from Census 2011 and 2021 for Wales and for local authority areas.
Ethnicity at local authority and MSOA level
Census 2021: ONS has issued a useful interactive maps where you can check numbers and proportions of diverse groups by Local Authority areas and smaller areas called MSOA’s. The map is a useful tool and you can use it below.
High level ethnic groups
Detailed ethnic groups
Ethnicity in Wales
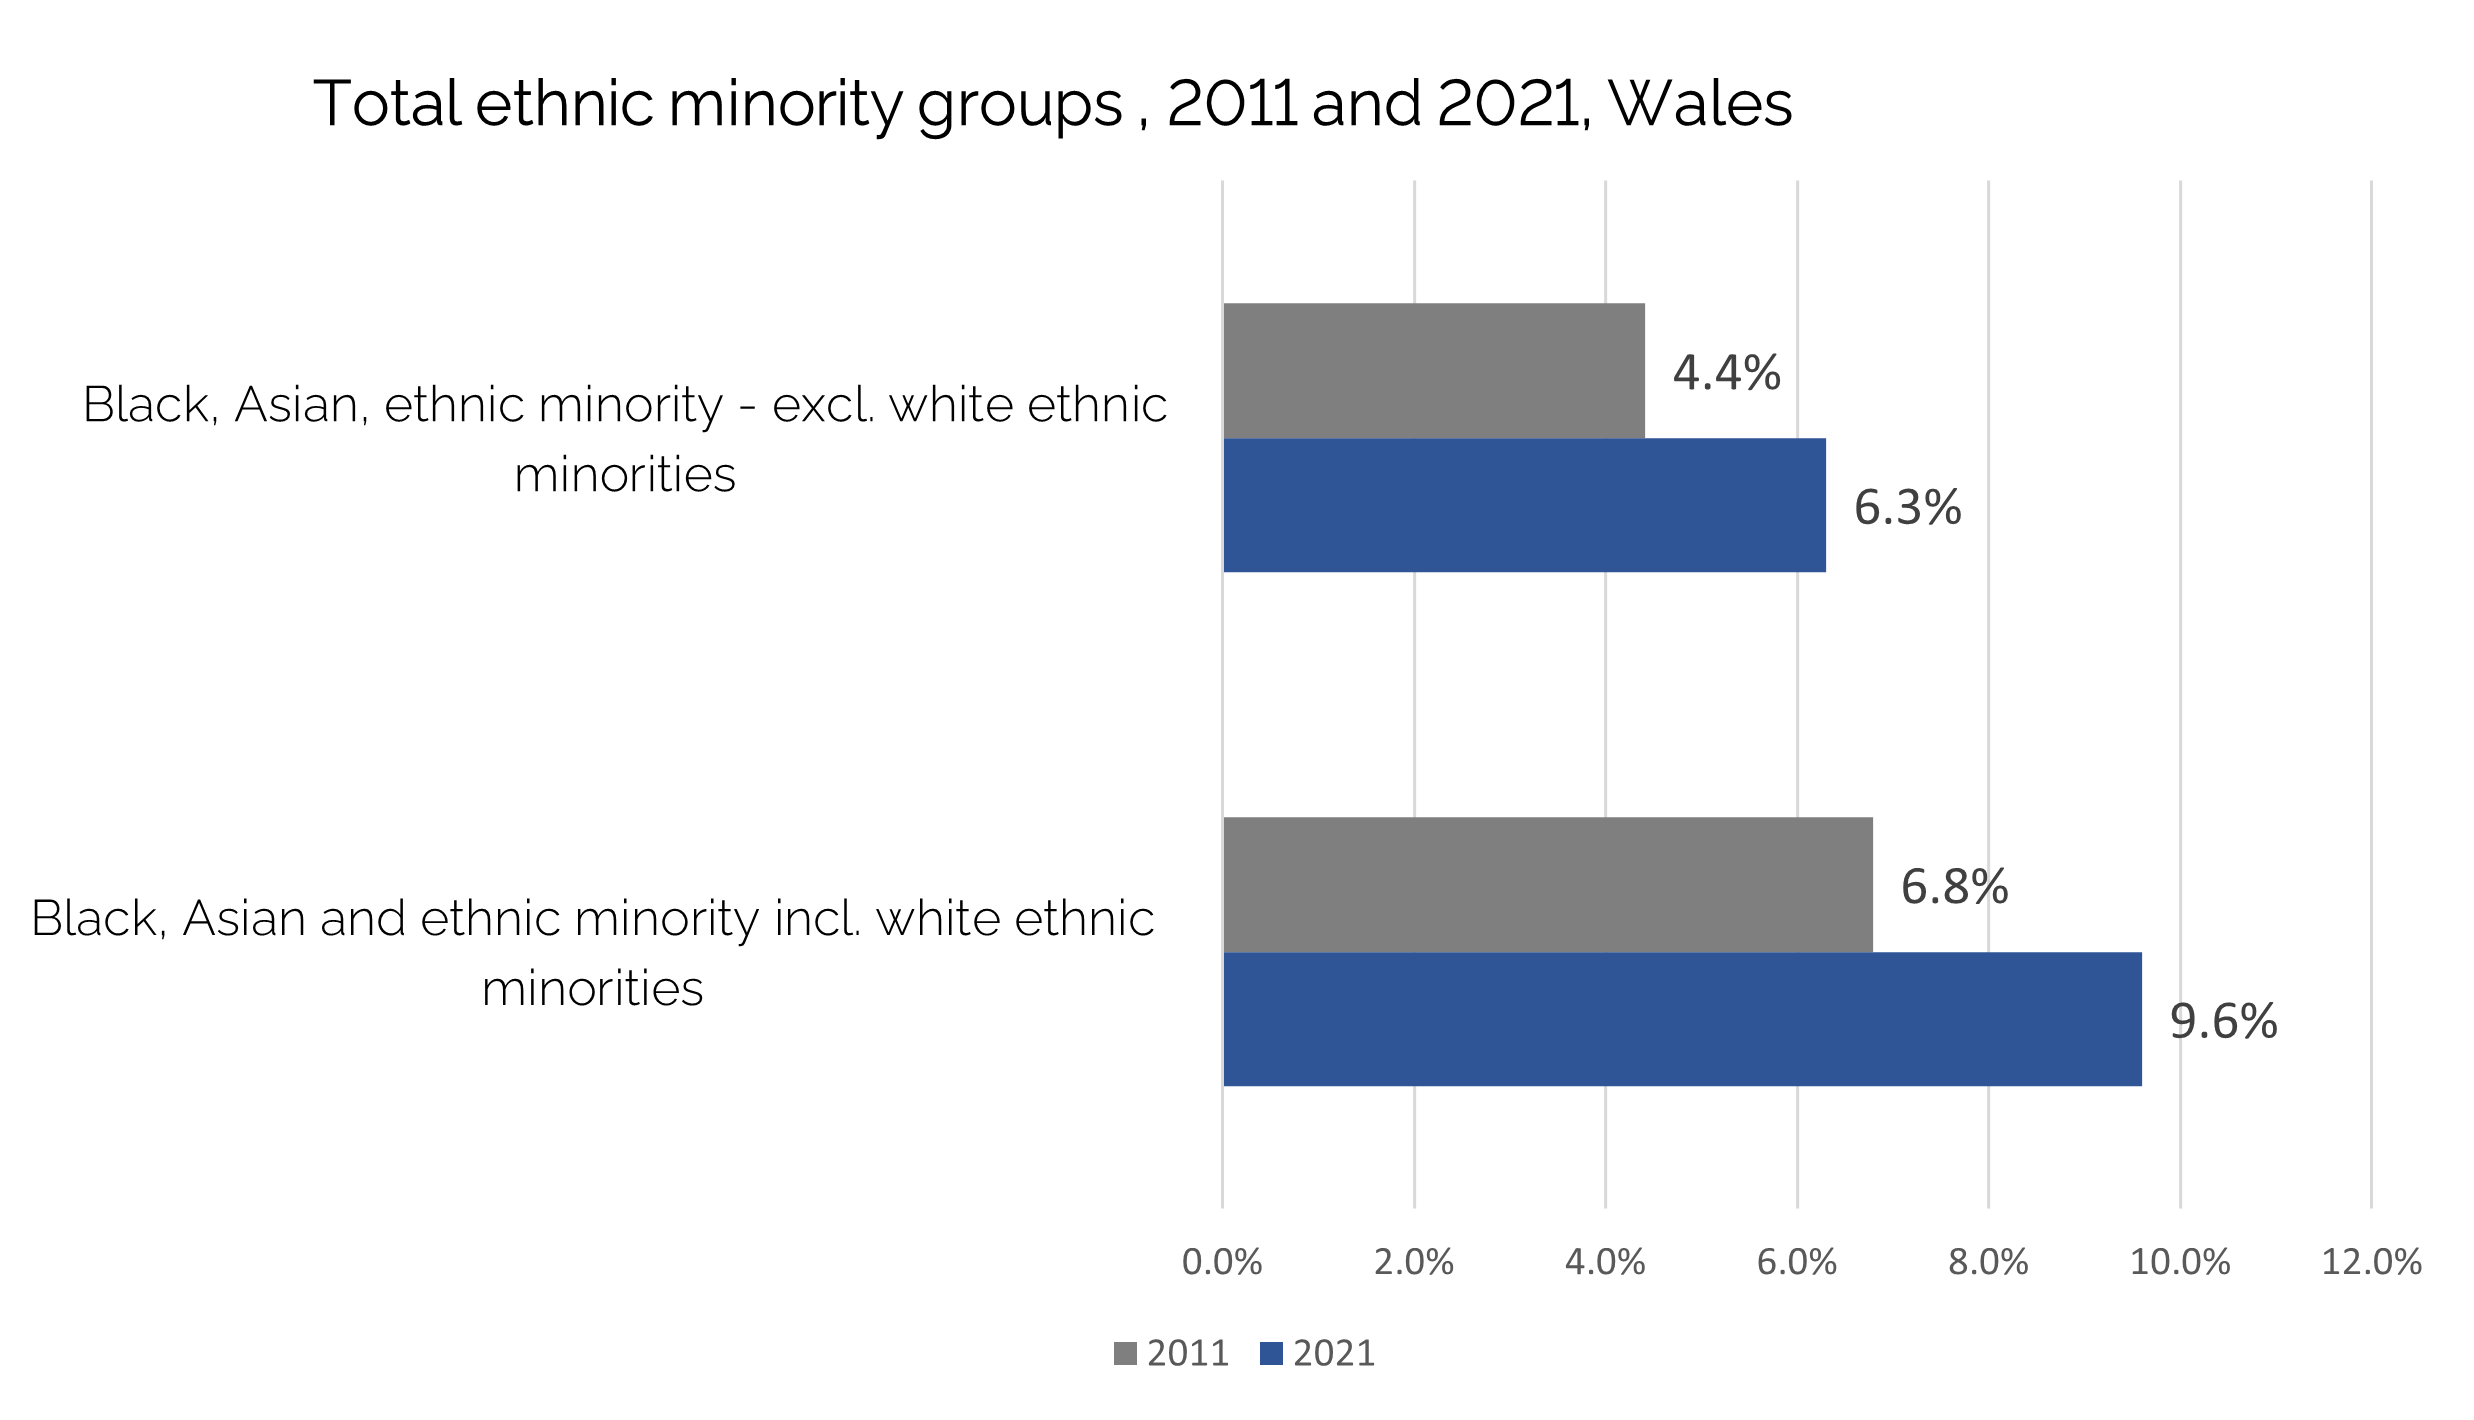
The percentage of Black, Asian and minority ethnic people increased in the last 10 years.
- Black, Asian and minority ethnic groups (excluding White ethnic minority groups) increased from 4.4% in 2011 to 6.3% in 2021
- However, if you include white ethnic minorities, the total population of Black, Asian and ethnic minority people changed from 6.8% of Wales’ population in 2011 to 9.6% in 2021
Data source: Census 2011 and 2021
White ethnic minorities include groups which identify as White Irish, Roma, Gypsies or Travellers and White Other category (mostly migrants).
High level ethnic groups: Wales
White ethnic minority groups have seen the biggest increase in numbers, rising by 0.9% in the past 10 years. This is followed by Asian groups and people with Mixed/Multiple ethnicity – both of which saw an increase of 0.6%. Black groups saw the smallest increase of 3% from 2011 to 2021. 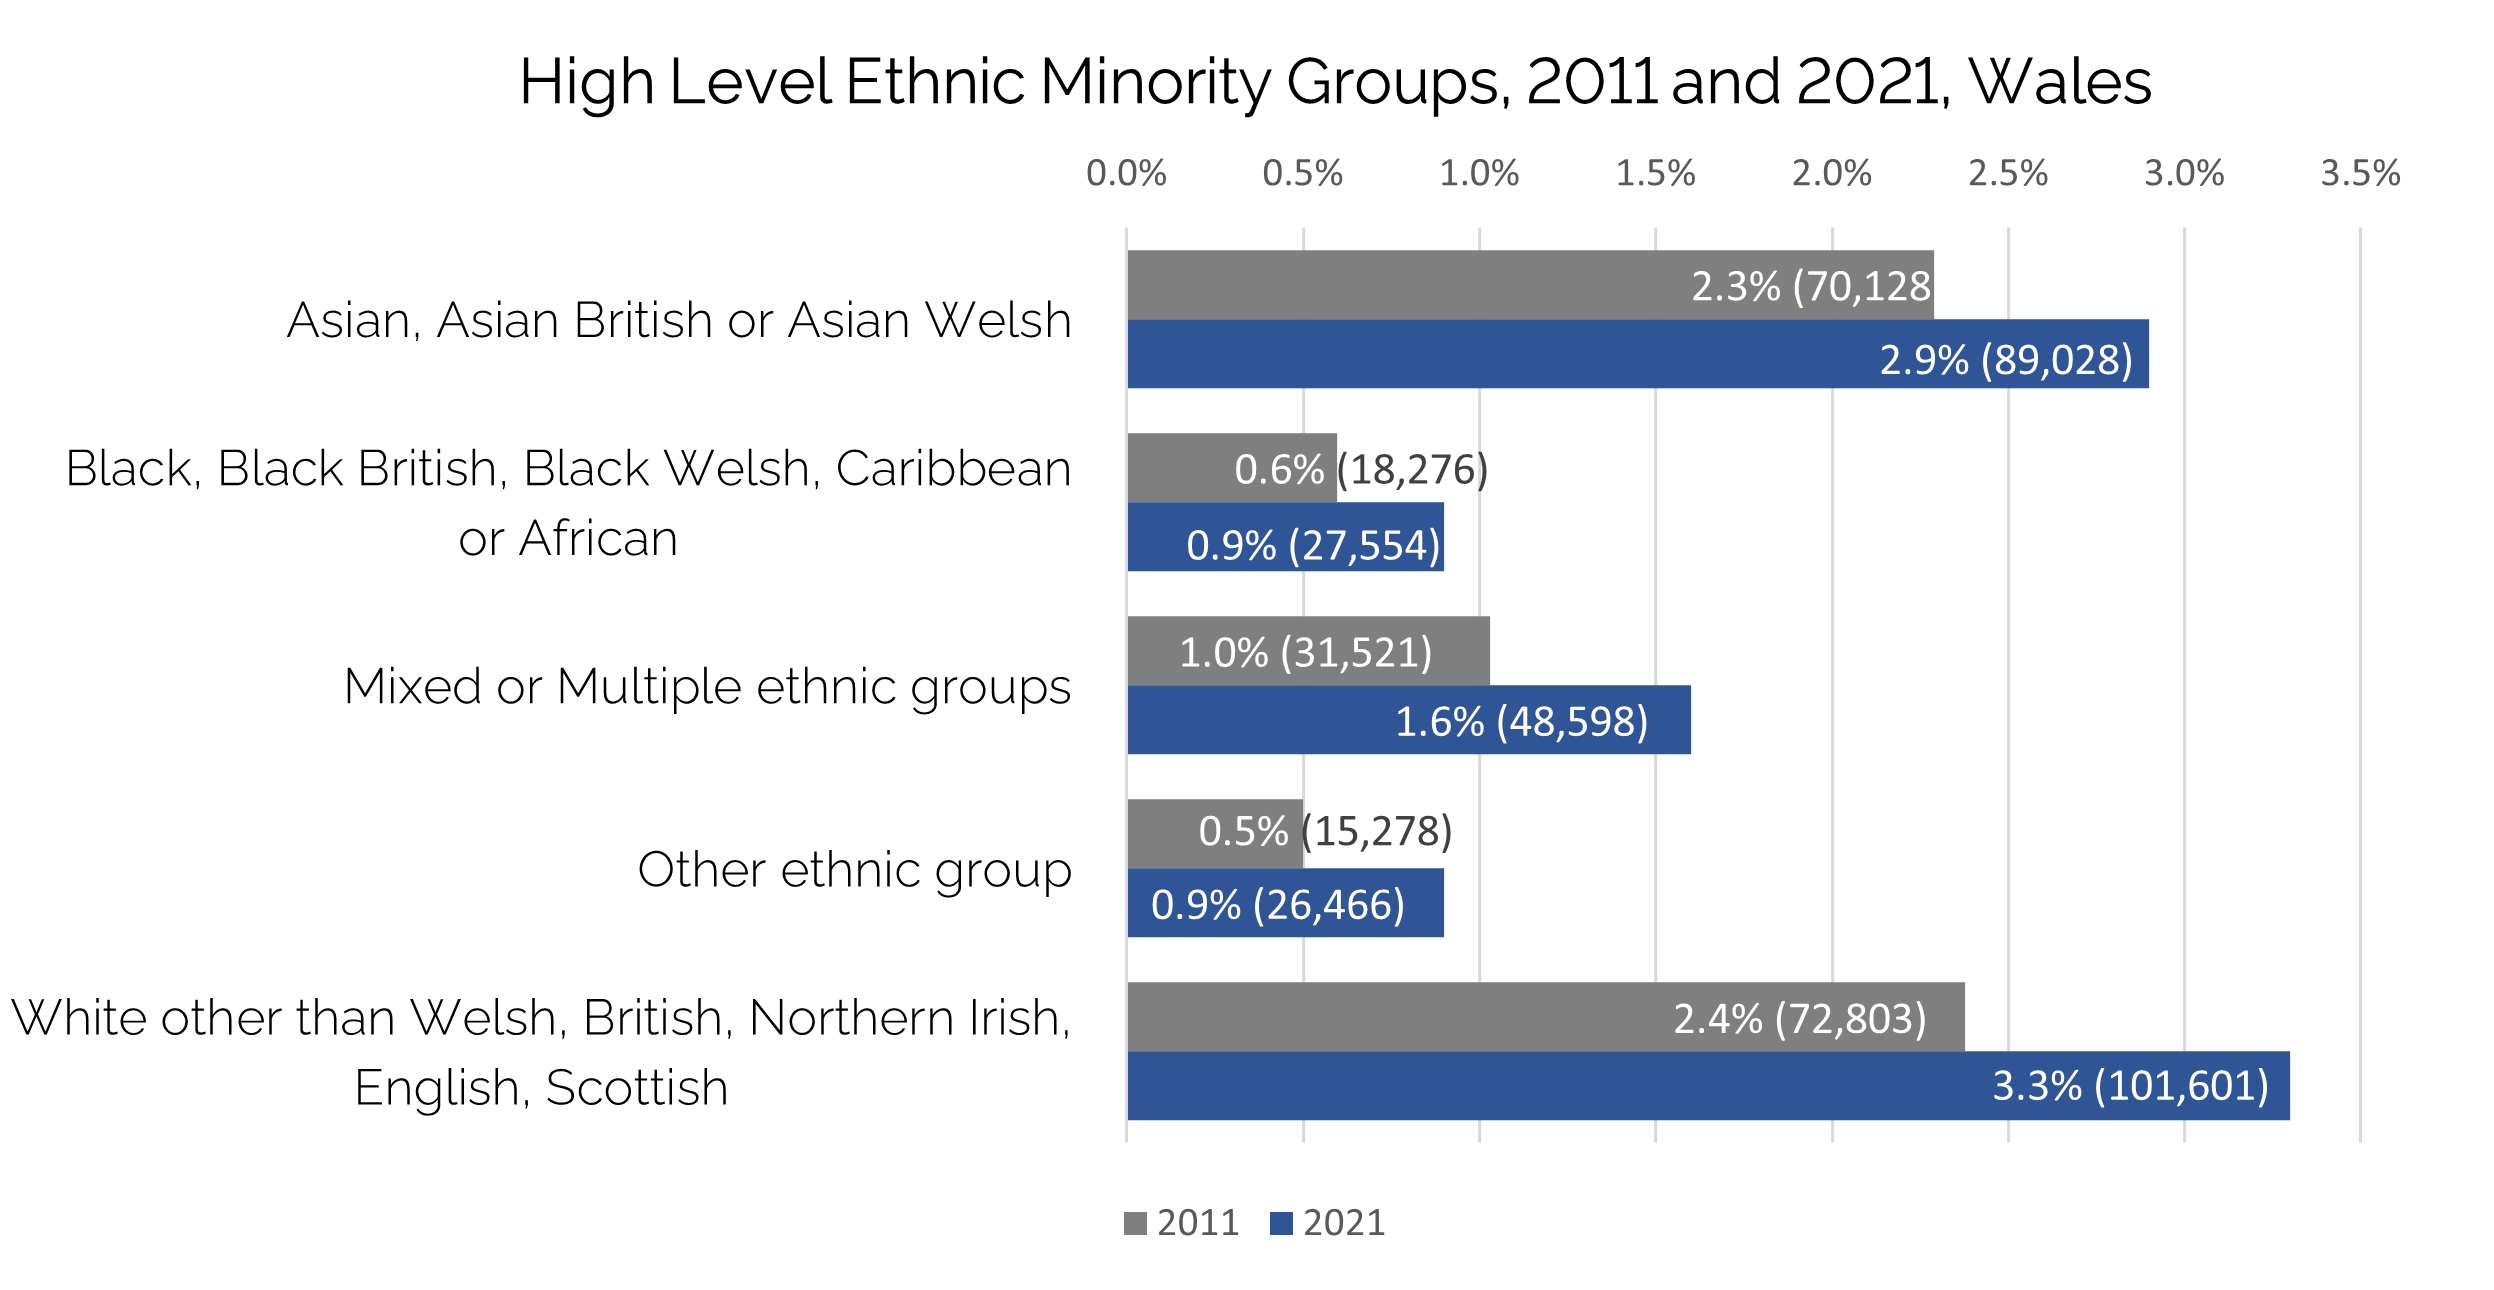
Data source: Census 2021
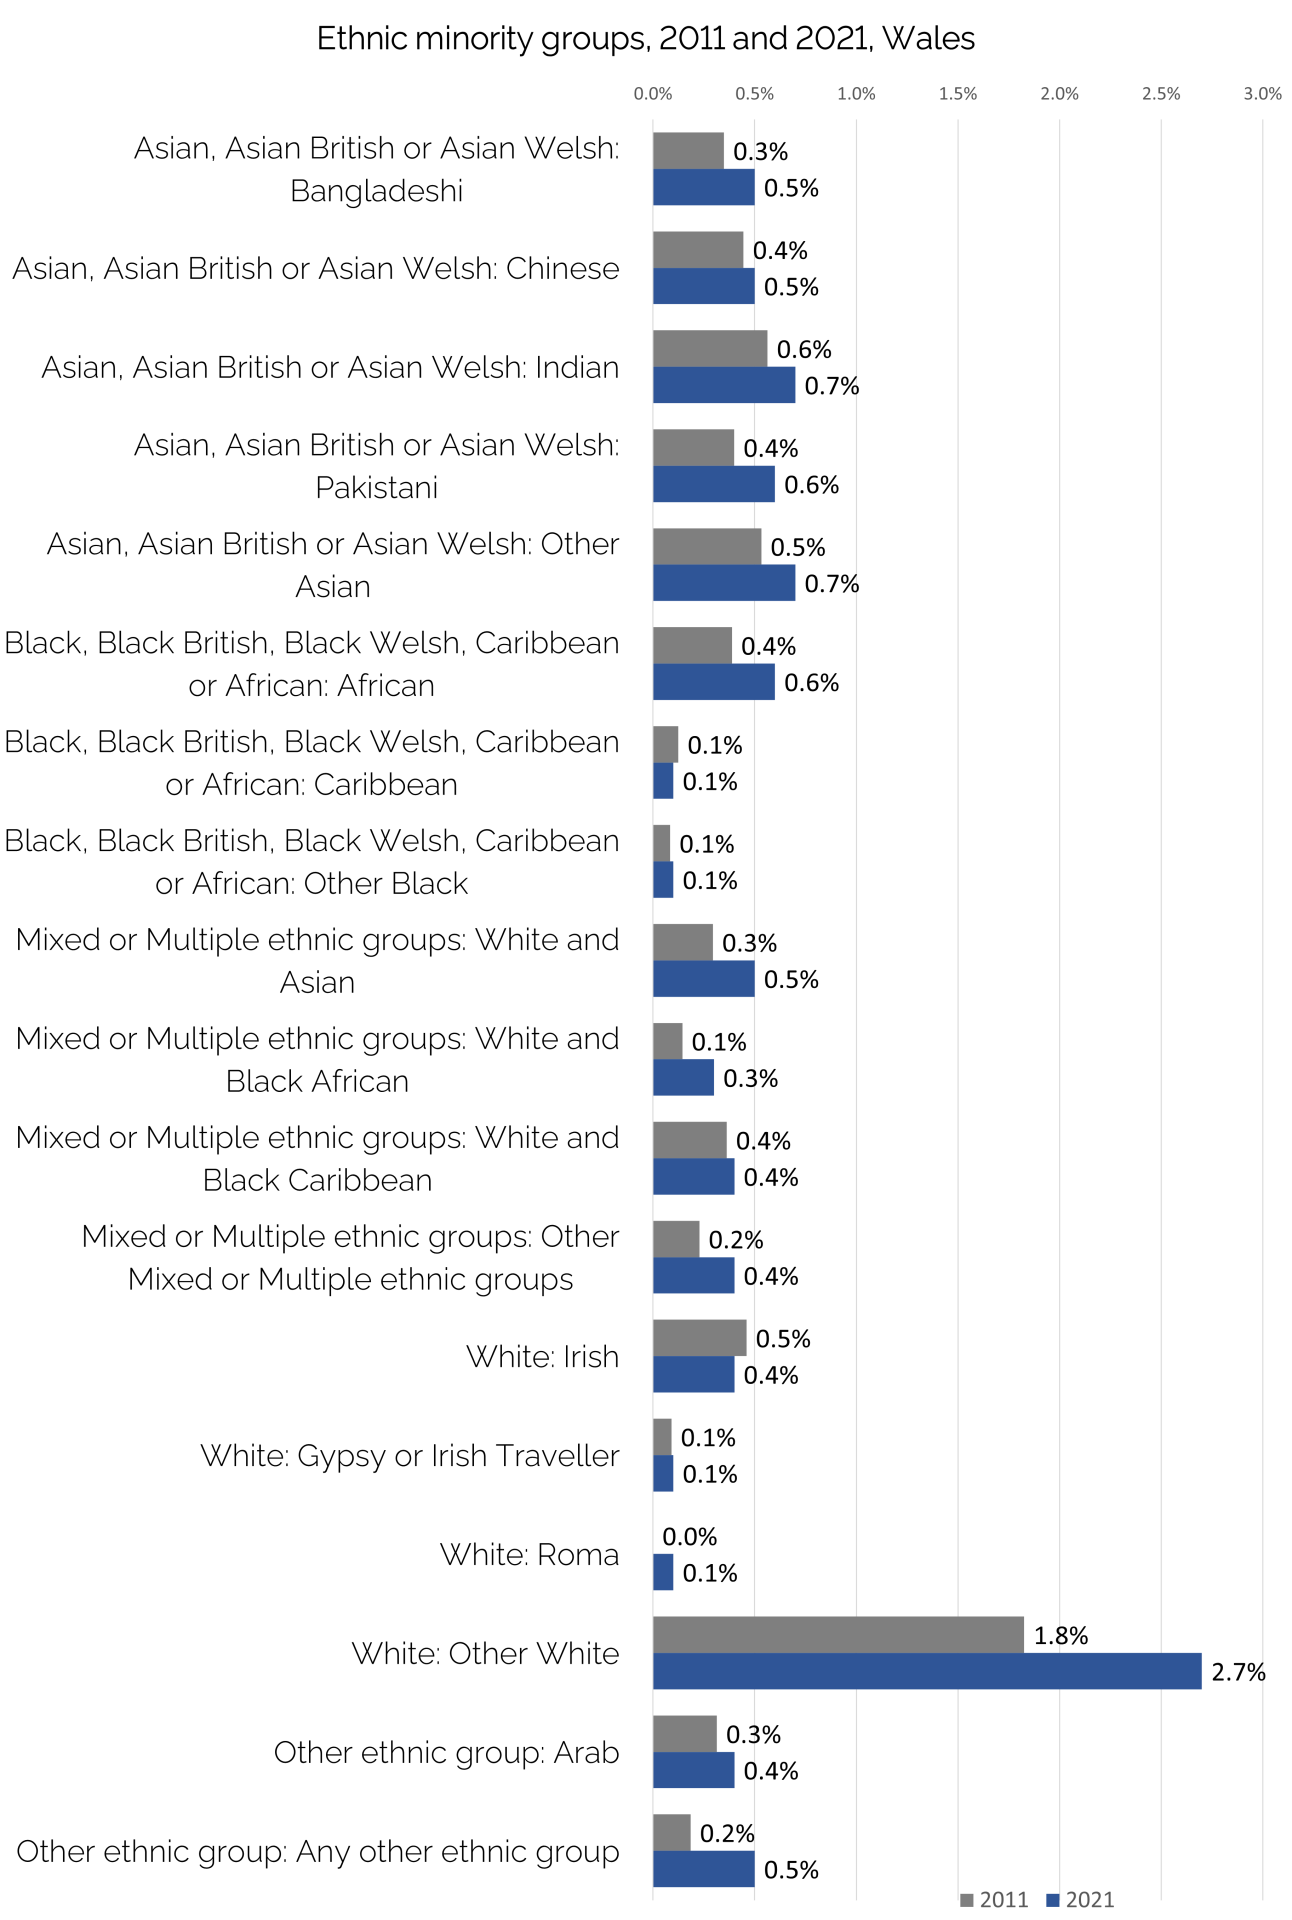
Detailed ethnic groups: Wales
The below figures illustrate the changes in groups relative to Welsh population, i.e. which groups increased as a share of total Welsh population and which shrunk.
The groups which saw the biggest increases as a proportion of Welsh population are:
- White other with 0.9% increase as a proportion of population (largest groups are Polish and Romanian)
- Any other ethnic group with 0.3% increase as a proportion of population (these are people who did not identify with any of the other categories)
Fastest/slowest increases
Some groups might have seen a big increase relative to their own size but still comprise a low proportion of Welsh population. Below are the groups which saw highest increases/decreases relative to their own size.
Fastest growing groups: groups with largest increases relative to their own size:
- People who identified as ‘Any other ethnic group’: despite comprising only 0.5% of Welsh population, this group was close to tripling in size (from 5,500 people in 2011 to nearly 15,000 people in 2021). These are people who did not identify with any of the specific ethnic categories and are part of the ethnic minority cohort.
- People who identified as ‘Other mixed/multiple ethnic groups’: despite comprising only 0.4% of Welsh population, this group was close to doubling in size (from 6900 in 2011 to 12,700 in 2021)
- People who identified as ‘Mixed White and Black African’: again despite only comprising 0.3% of Welsh population, this group was close to doubling in size (from 4,400 in 2011 to 8,000 in 2021)
- People who identified as Black African: while comprising 0.6% of Welsh population, this group increased by 67% (from nearly 12,000 in 2011 to nearly 20,000 in 2021)
Where can I find and analyse the Census 2021 data?
If you want to analyse the data yourself, use Census website or the ‘query data’ function on Nomis website.
How can I use this data?
If you are interested in finding out more about how this data can be used as part of your organisation’s equality monitoring or customer profiling:
- Check out our equality monitoring resource page
- Book our training on equality monitoring and/or equality impact assessments
Please note the material in this section is for information purposes only and does not constitute legal advice. Tai Pawb is not responsible for the content of external resources.